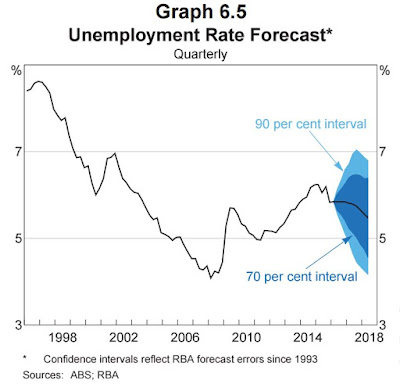
Today's Statement on Monetary Policy from the Reserve Bank of Australia had some graphs that make the point quite well. Here are the RBA's forecasts for Aussie GDP growth, core inflation, and the unemployment rate over the next two years - plus the confidence intervals around the central forecast, based on how well the RBA's forecasts have actually turned out since 1993.
Even if you are a good forecaster - and central banks tend to be at least as good as any others in the forecasting game - and your best guess is that GDP growth will be a little over 3% in two years' time, the likelihood (going by the 70% interval) is that it's actually going to be somewhere in a band from a bit under 2% to around 4.5%.
In other words, your best call is that the economy is growing at or a little better than trend, and you probably don't need to do anything to monetary policy from a growth perspective. But it might turn out (given that monetary policy has long lags) that right now you should easing (because the economy is actually heading for well-below-par sub-2% growth) or that you should be hitting the brakes (because it could as easily be heading for boom-time 4.5% growth). And bear in mind that there's roughly a one in three chance that the actual outcome might be something else again - even slower or even faster. And (as you'd expect, since they're all linked) there are similar uncertainties over inflation and unemployment.
Let's not forget, either, that this is uncertainty about the future, when, in addition, there's uncertainty about the starting point of the here and now. That's why the Fed of Atlanta, for example, has felt it needed to come up with its "nowcast" of where US GDP currently lies. The rotten tomatoes will have their uses someday, but the reality is that monetary (and fiscal) policy making, real time, is a lot more difficult than it's often given credit for.
On the substance of what's actually happening in Australia, I was interested in these two graphs.
In the top one, you'll see that non-tradables inflation, the pricing pressure generated domestically and the only bit of inflation that a central bank can really expect to control over the longer haul, has been falling sharply over the past three to four years. In the bottom one, in the 'Administered' panel, you'll see that the prices that get announced to you in a largely non-market way - the rates, school fees, medics and medicines, the cost of a stamp - are also not going up anywhere near as much as they used to. They're still going up in Australia by 4% a year, sure, but it's nothing like the 7% they were getting away with four years ago.
And there you have the big puzzle for central banks everywhere (including ours), given that these patterns, and others, including sharply lower inflation expectations, are common across a wide range of developed economies. Inflation has headed lower than central banks (and everyone else) thought it would, given the cyclical state of the developed economies, and there's scant sign of it returning to the target bands central banks are meant to be policing. If anything, current inflation expectations suggest the undershoot will either persist, or get even larger.
So, as well as the cyclical uncertainty over where the economy is right now, and the cyclical uncertainty over where it might go next, there's an even bigger, structural one: why isn't inflation behaving the way it used to? And that's where life gets really tricky for central bank governors.
Because nobody knows.


No comments:
Post a Comment